Sensor Readings
This page allows to view sensors data of vending machine.
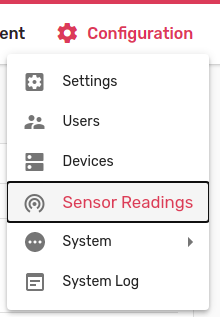
In order to access the page, select Configuration → Sensor Readings.
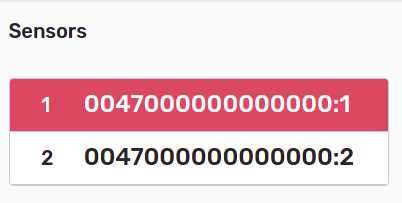
Connected sensors are displayed in the list on the left. To select a sensor, click on the sensor cart. Selected sensor will be highlighted in red.
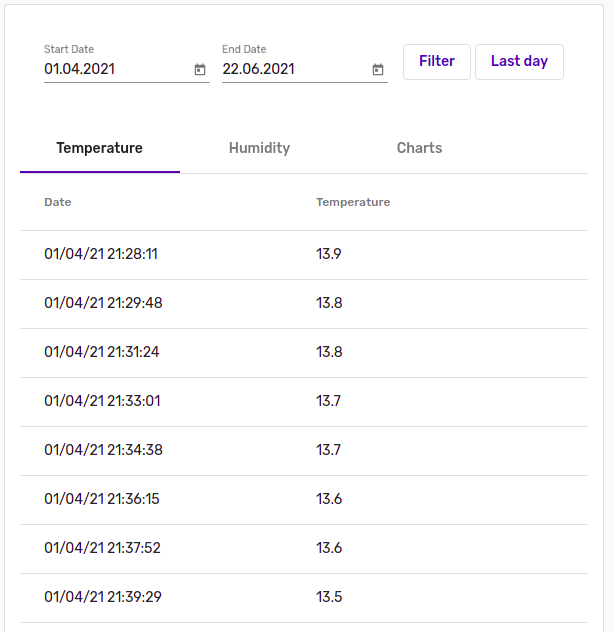
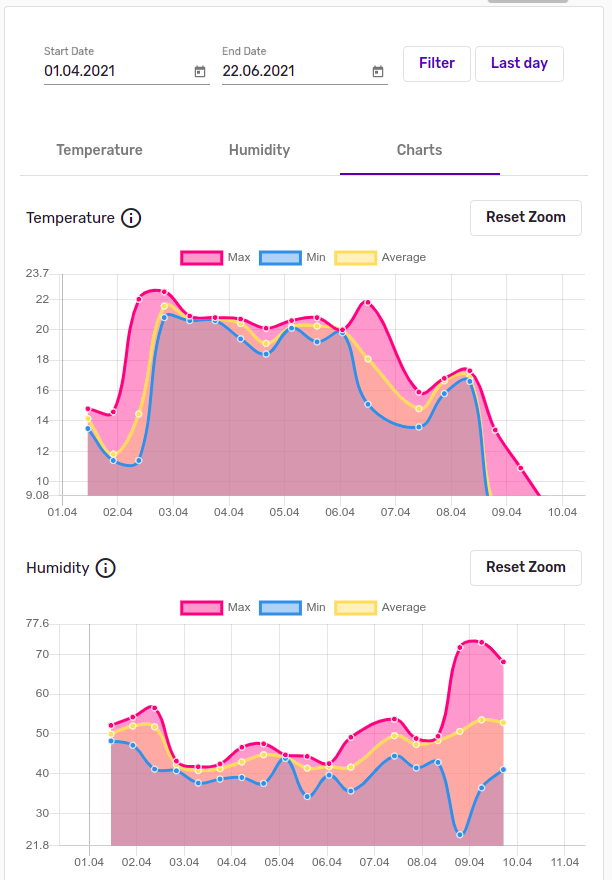
Sensor data is displayed on the right as a table with tabs. Each tab displays data for separate metric (e.g., temperature, humidity, etc.). The last tab displays charts for all metrics.
Depending on the selected date period, chart data may be approximated. For the convenience, the minimum, maximum and average data are displayed on the chart.
- Sensor data
- Charts
Zooming charts
Charts can be zoomed. To zoom a chart, select the desired area. Zoom will apply automatically.
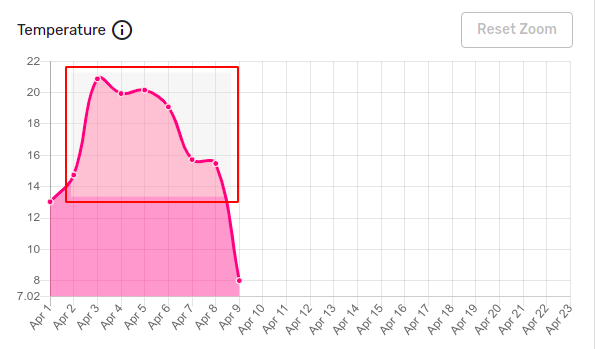
To reset zoom, click Reset Zoom at the top of the chart.
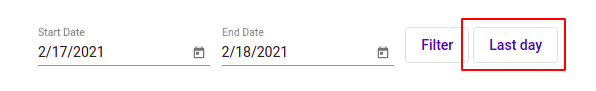
Filtering sensor readings
Sensor's data can be filtered by Date. By default, it is shown for the last 24 hours. 24-hour filter can also be activated at any time by clicking Last Day.
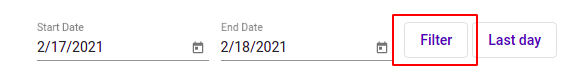
To filter sensor readings, select date interval in the Date fields and click Filter.
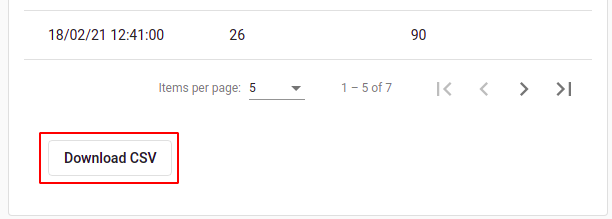
Downloading CSV
Sensor's data can be downloaded into the csv file by clicking Download CSV at the bottom of the table.